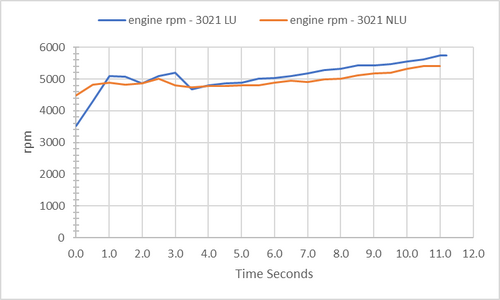
I took some points out of a power logger file of a 1/4 mile run from zero seconds to 11 seconds (that was the 1/4 ET) in 1/2 second intervals. Just goofing around, but it gives a picture of what is happening through the run.
Power is just a form of F=MA per time. So, the power actually accelerating the car is P=V*A*Mass. This is the power applied to accelerate the car forward minus aero, friction losses, and other losses. I pulled the MPH vs time from the PL, plotted in excel, and then added a polynomial trendline to the chart. Excel does the hard work, but once you have the trendline(and formula), the acceleration is the derivative, and the distance is the integral. I integrated for the distance as an accuracy check. After 11 seconds distance is 1331ft, close enough to 1320 for what I am doing.
Initially(60ft) the aero and rolling resistance is negligible, but the biggest parasitic loss is force applied in a direction other than parallel to the horizontal 1/4 mile direction i.e. the direction required to increase the speed of the car. Any rise in the body or rotation of the body, such as a wheelie, squatting, or even excessive separation of the back wheel is energy consumed and wasted. Additionally, you likely get a fair amount of loss in the torque convertor until the turbine gets to a certain rpm. That rpm will be an inherent feature of the converter design.
The aero drag force is a semi rough estimate.
I don’t know the exact HP curve of my car, but you can get an idea of what is being put to ground. The rolling friction losses are likely somewhat small and I would expect to increase with velocity squared. Ultimately, getting the HP applied curve as flat as possible and as close to the crankshaft HP as possible will net the best acceleration.
Does anybody know if the high end engine management systems offer these kinds of outputs?
Analyzing data like this could be very beneficial for doing before and after change comparisons. Turbos, converters, suspension, whatever…
